Notifications
Detect and follow up deviations in consumption, price, demand, water and district heating. Learn tabs, mark‑as‑read and email alerts.
What are Notifications?
Notifications help you detect anomalies early and take action.
- Quick updates in the notification bell
- Details and history on the Notifications page
- Choose which categories are sent by email
Two views
- The bell (top right): quick view, filter Unread/All, mark as read, open full page
- Notifications page: full overview, organized in tabs per category with filters and email preferences
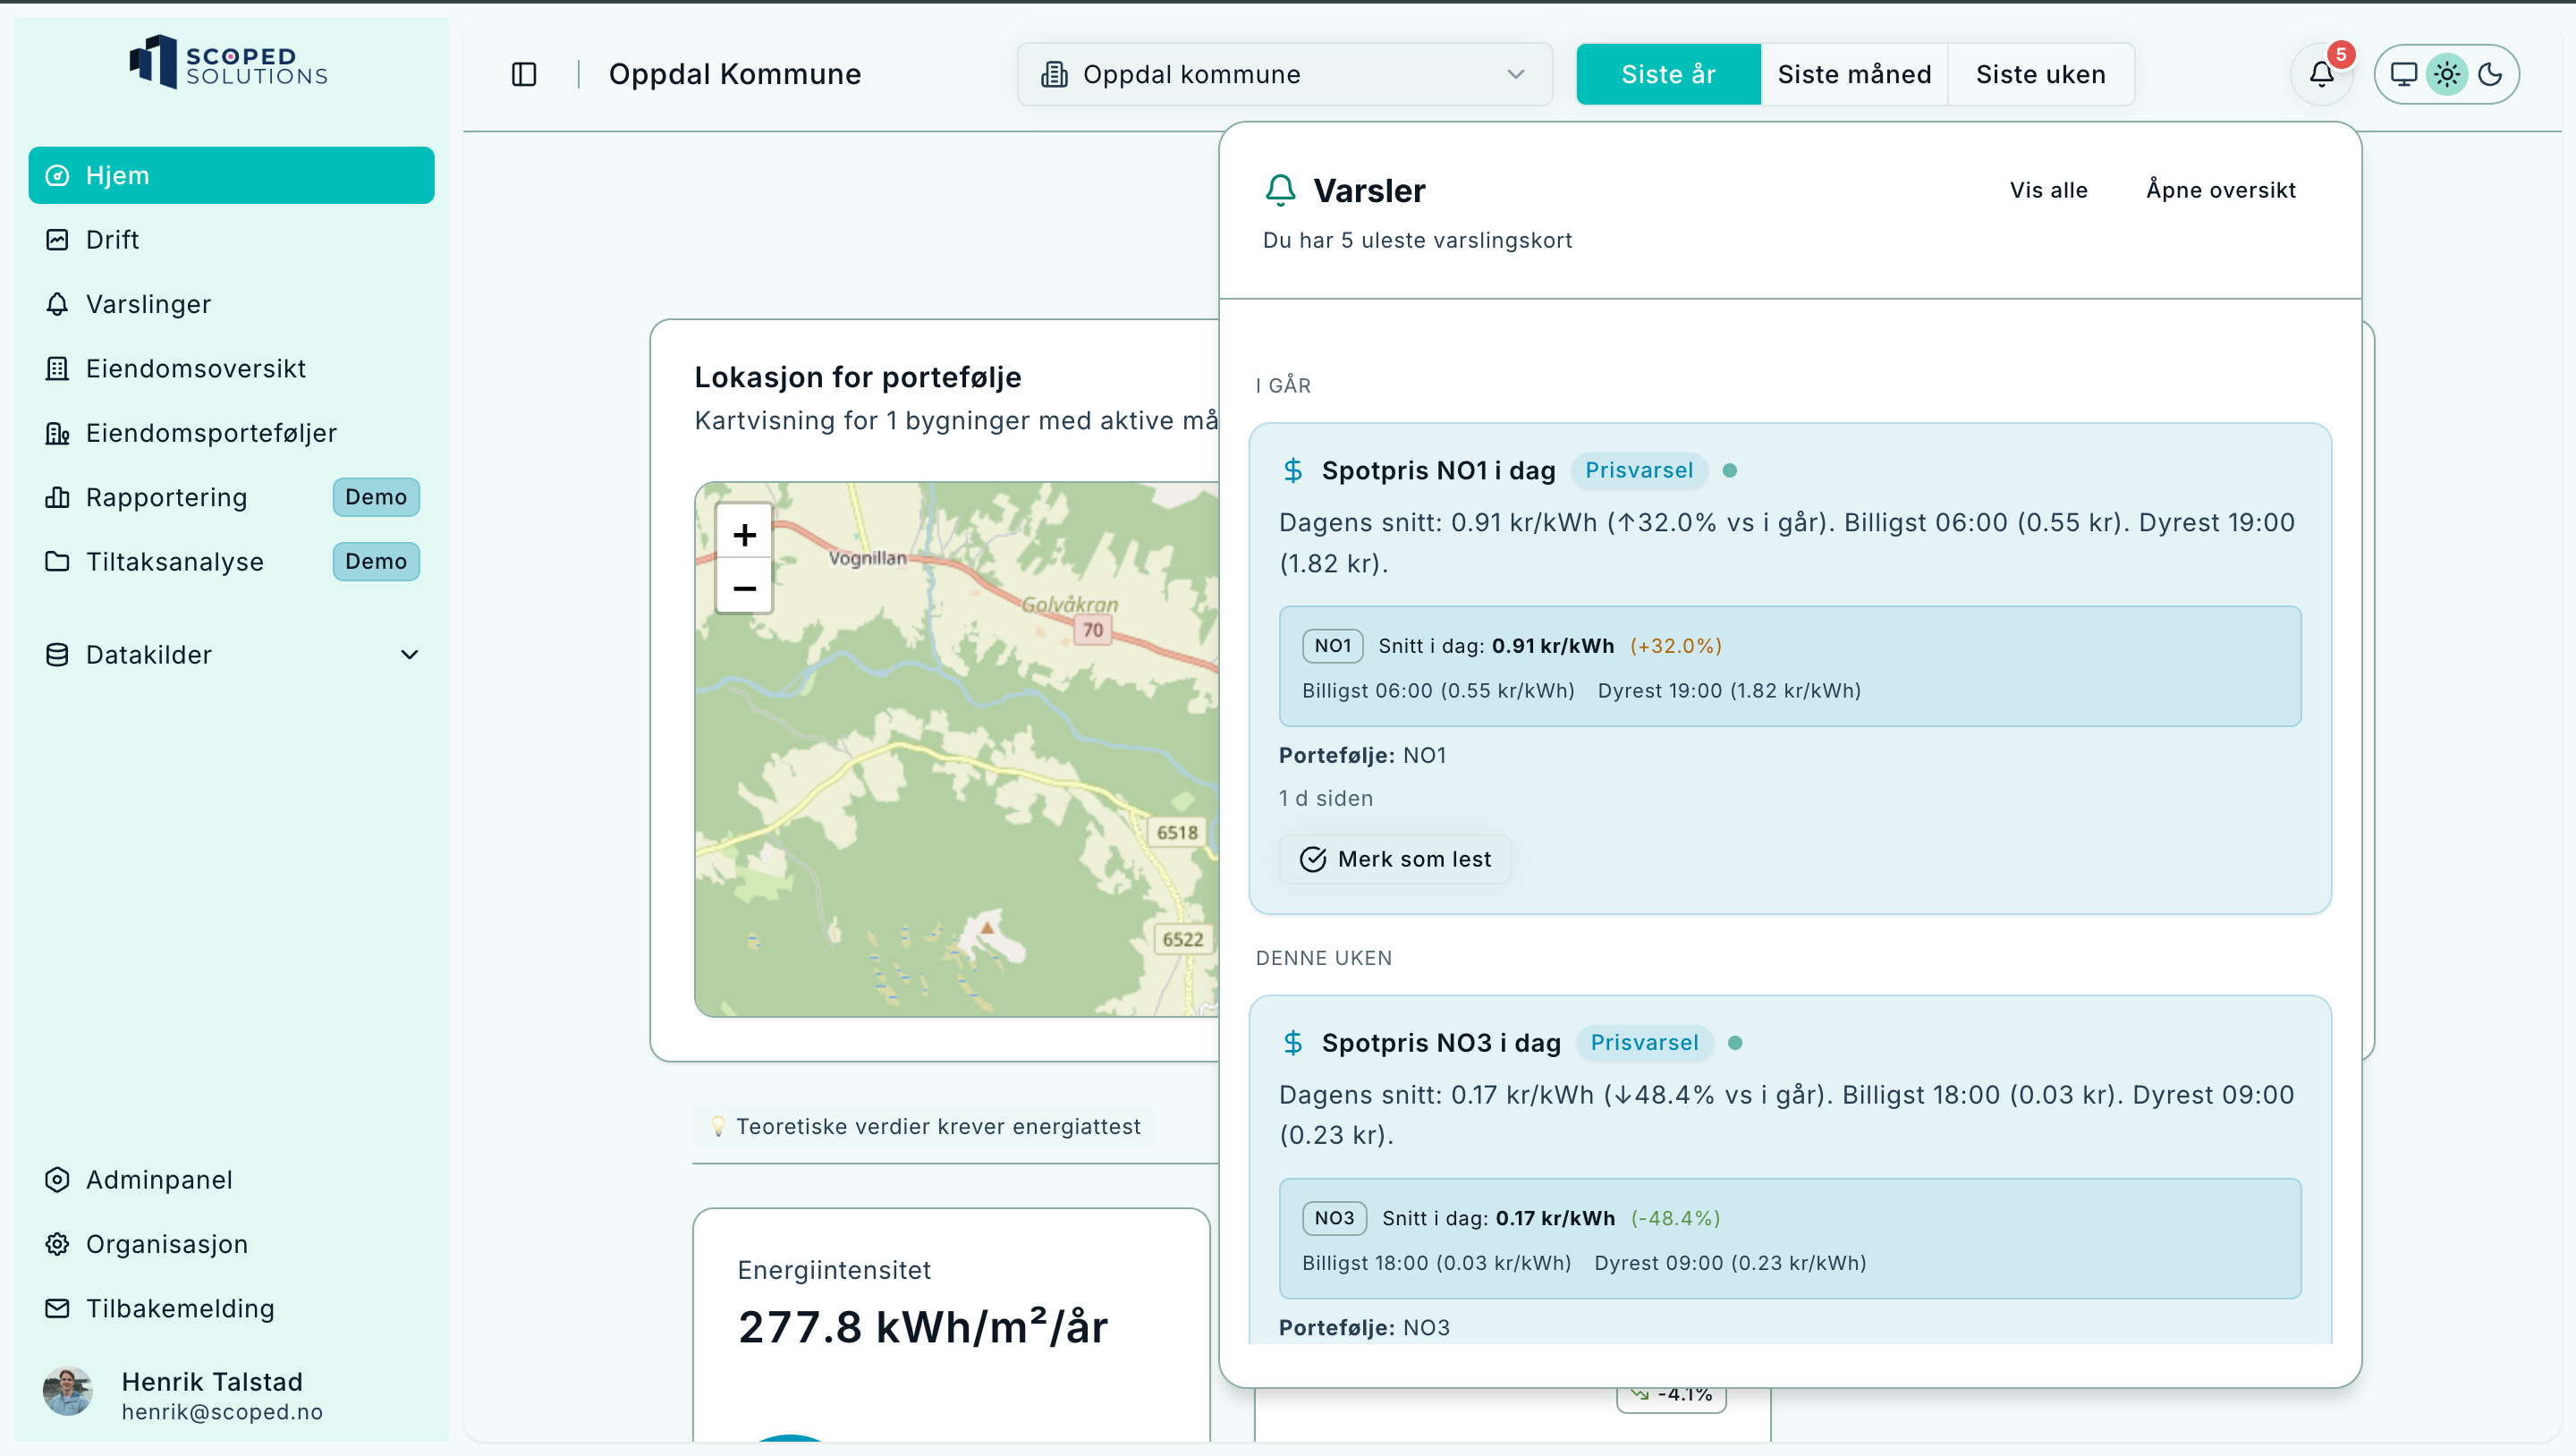
The bell gives short summaries of new alerts.
Tabs on the Notifications page
All notifications
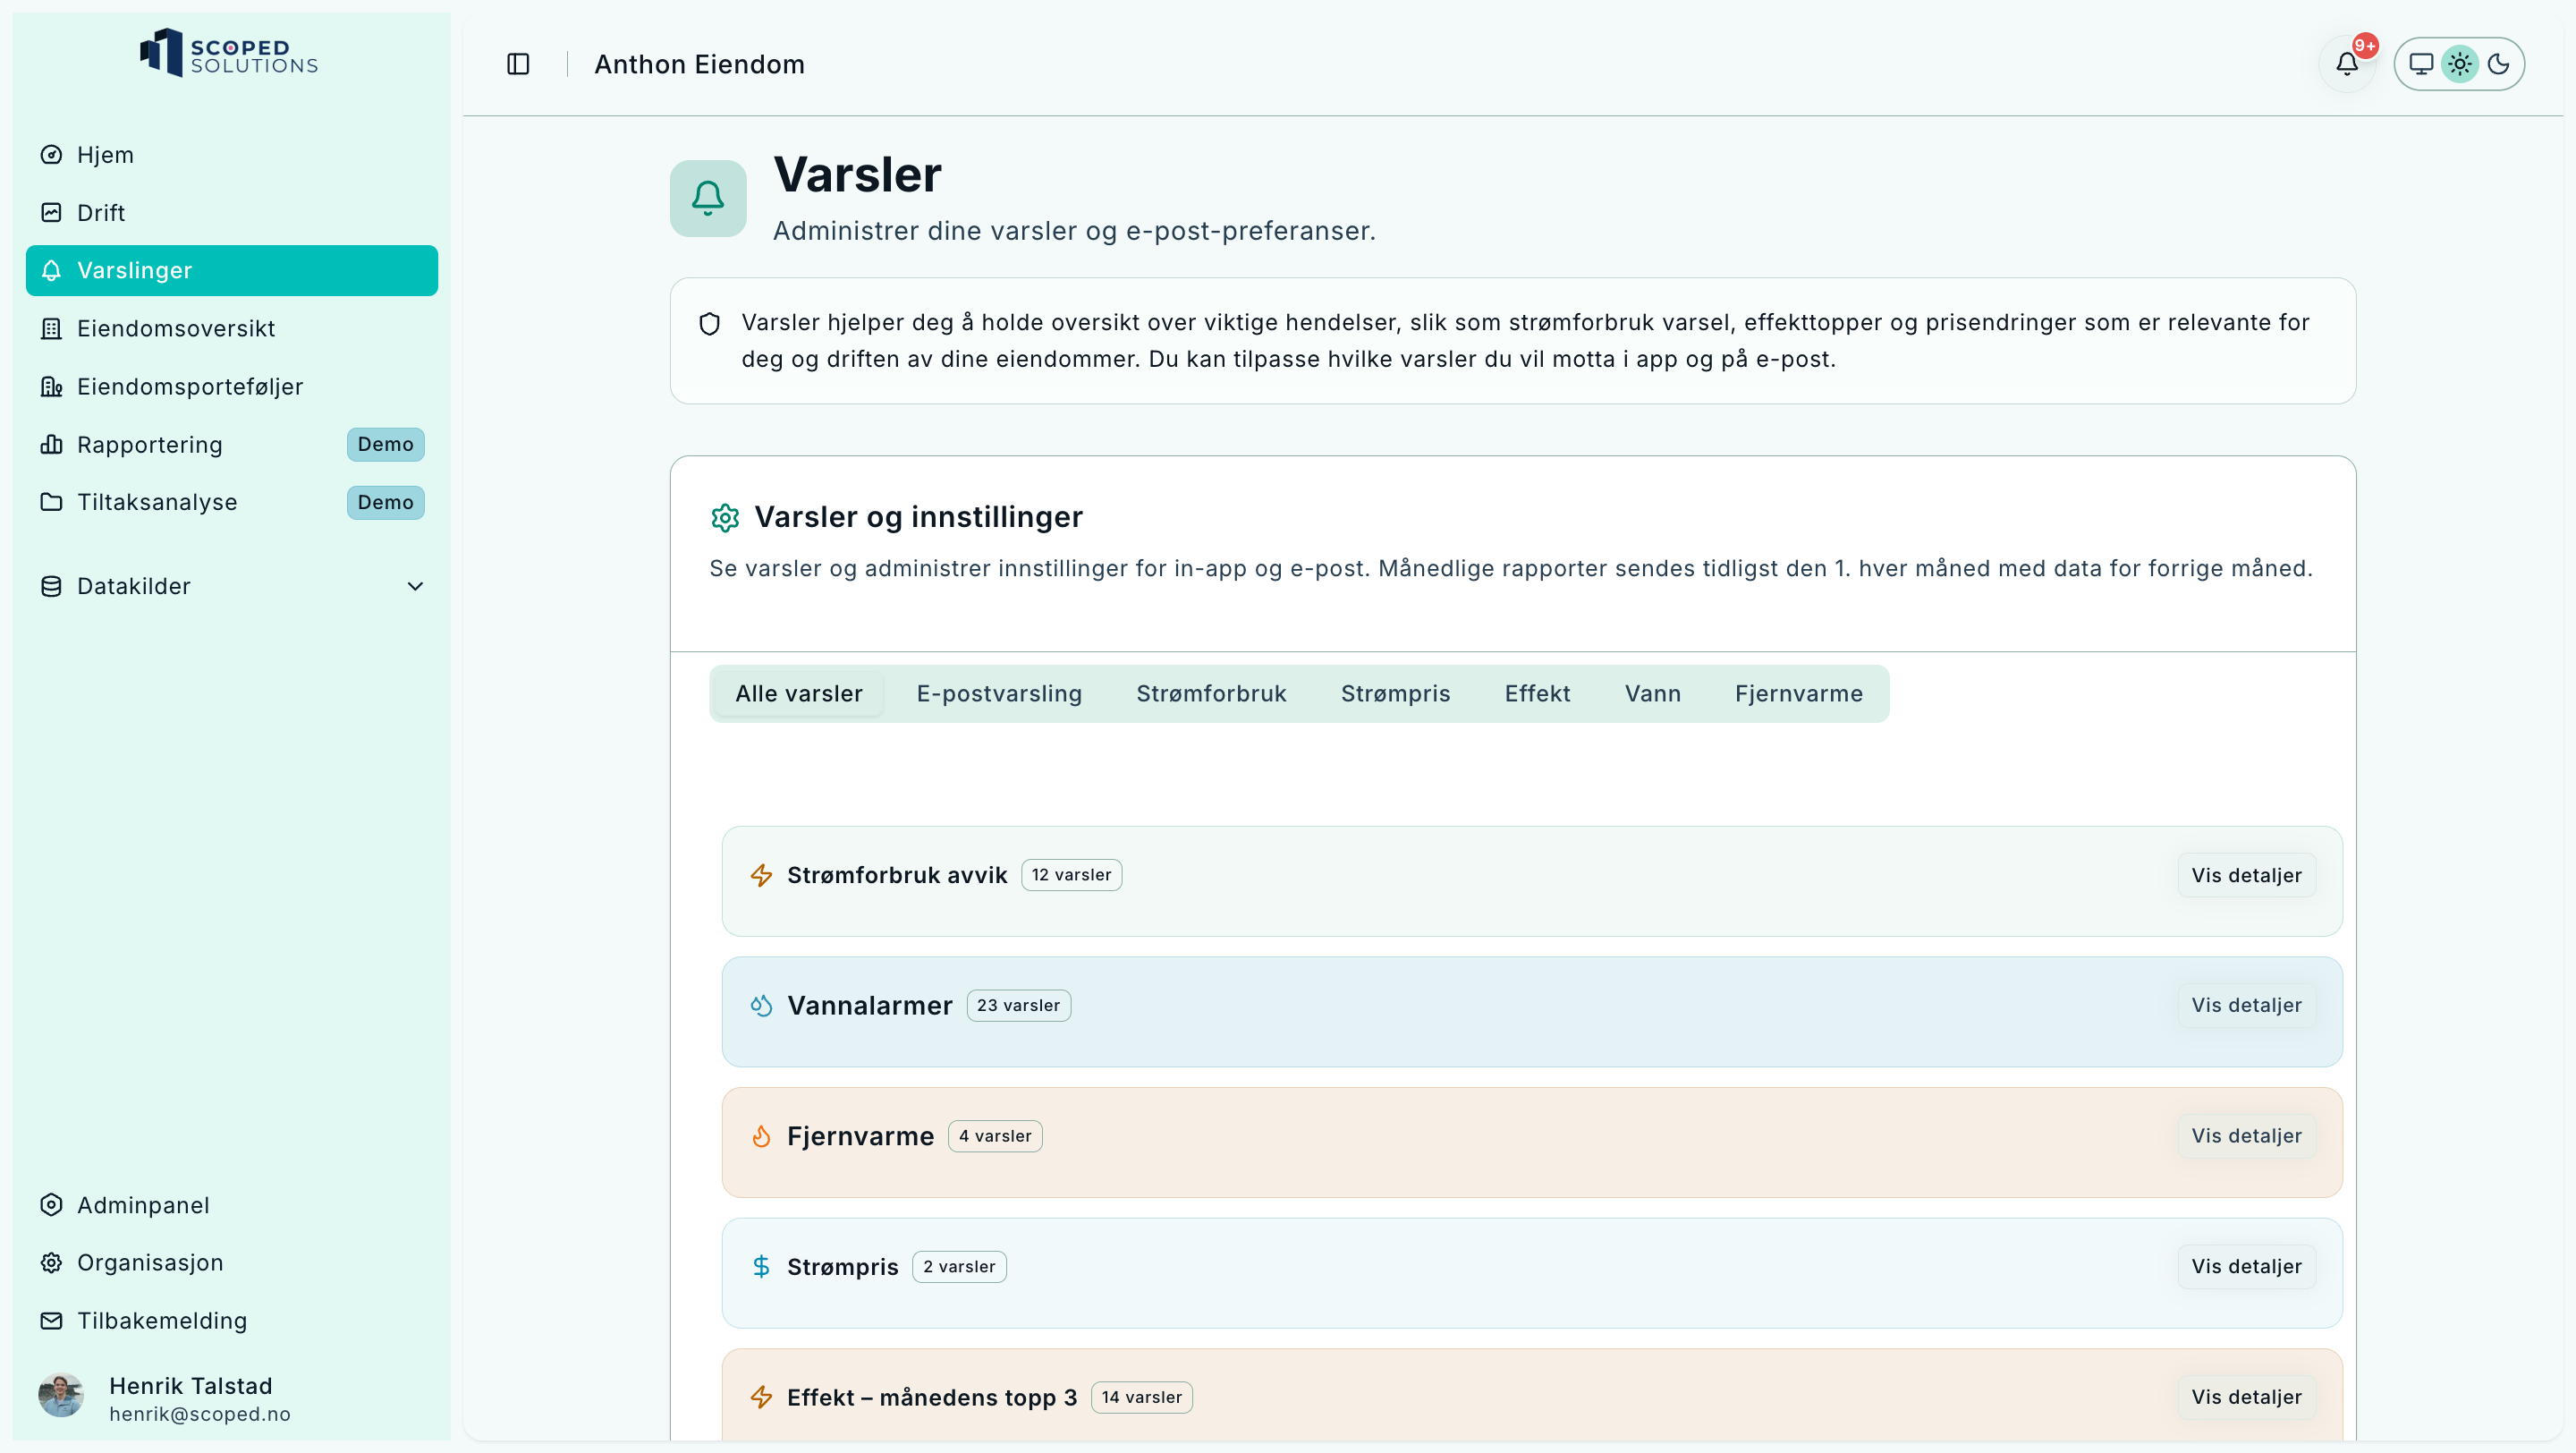
All events grouped by time.
- Unified list of all events
- Grouped by time and type
- Mark as read or open details
Email alerts
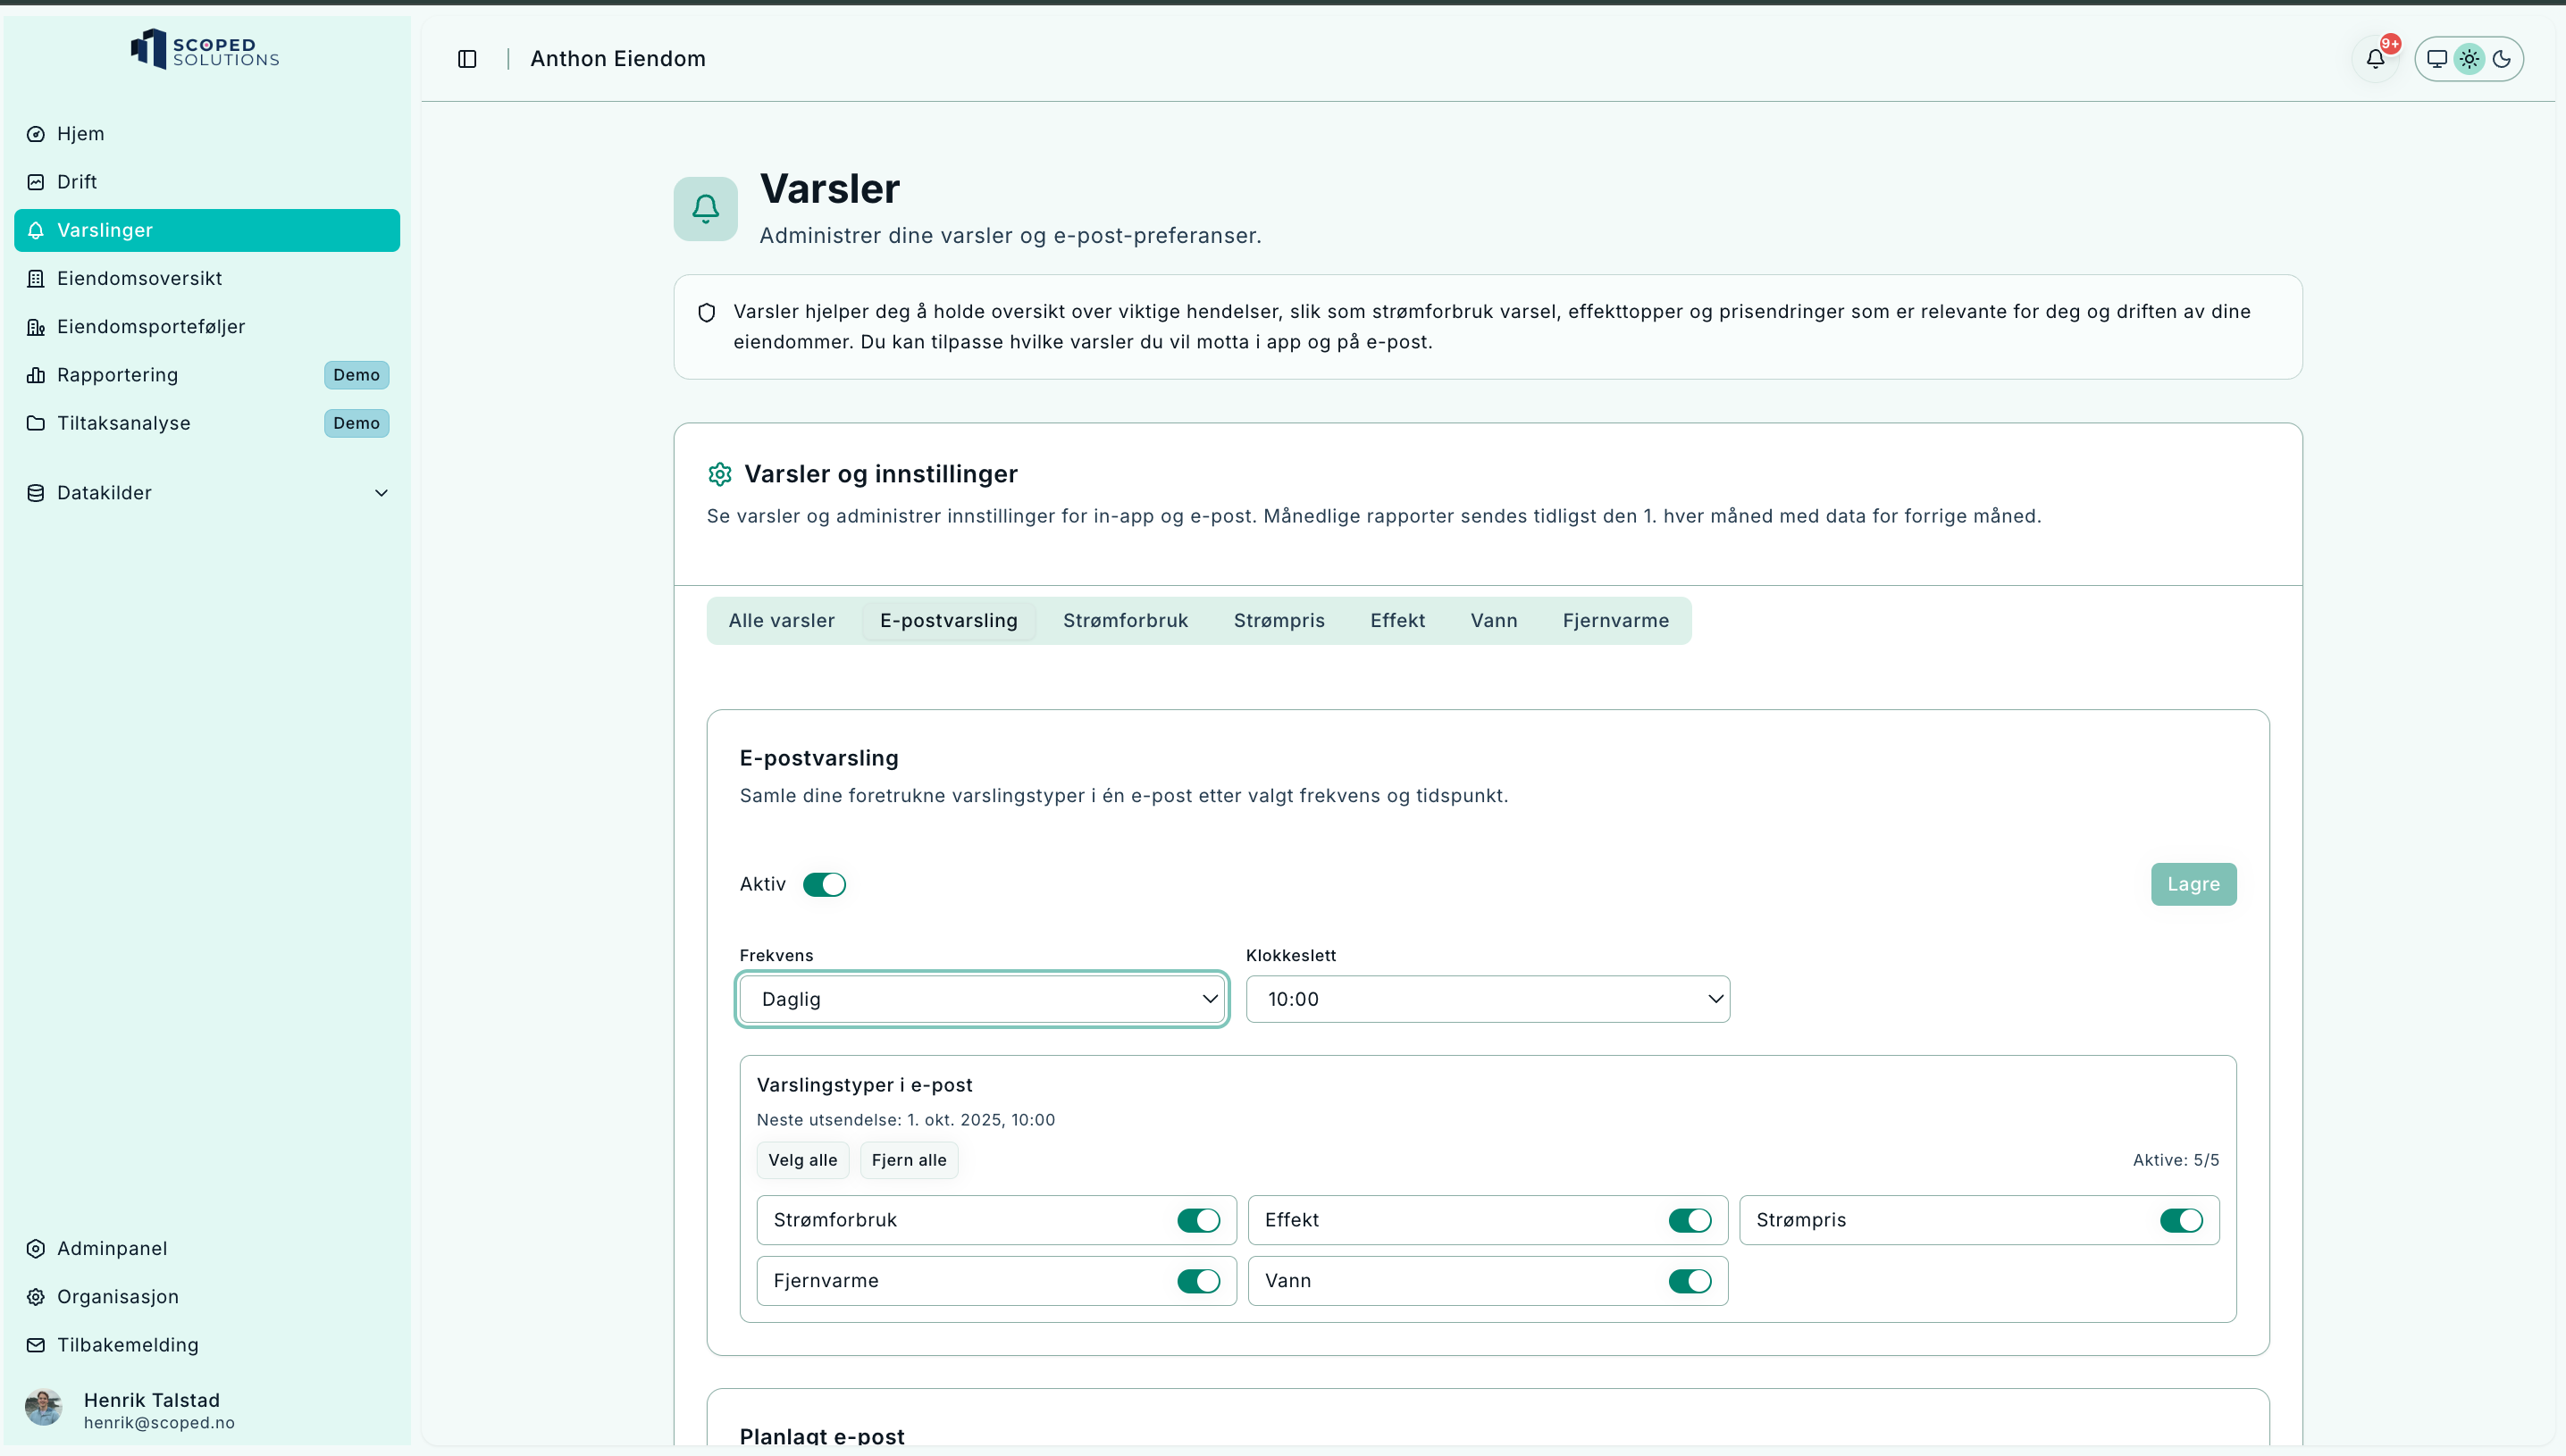
Control if, how often, and when to receive email alerts.
- Toggle email alerts on/off
- Select frequency: daily, weekly, or monthly
- Choose categories: Consumption, Demand, Price, Water, District heating
- Set a delivery time
How to configure
- Toggle Active
- Select Frequency and Time
- Check the Categories you want included
- Click Save – the next scheduled delivery is shown below
Electricity consumption
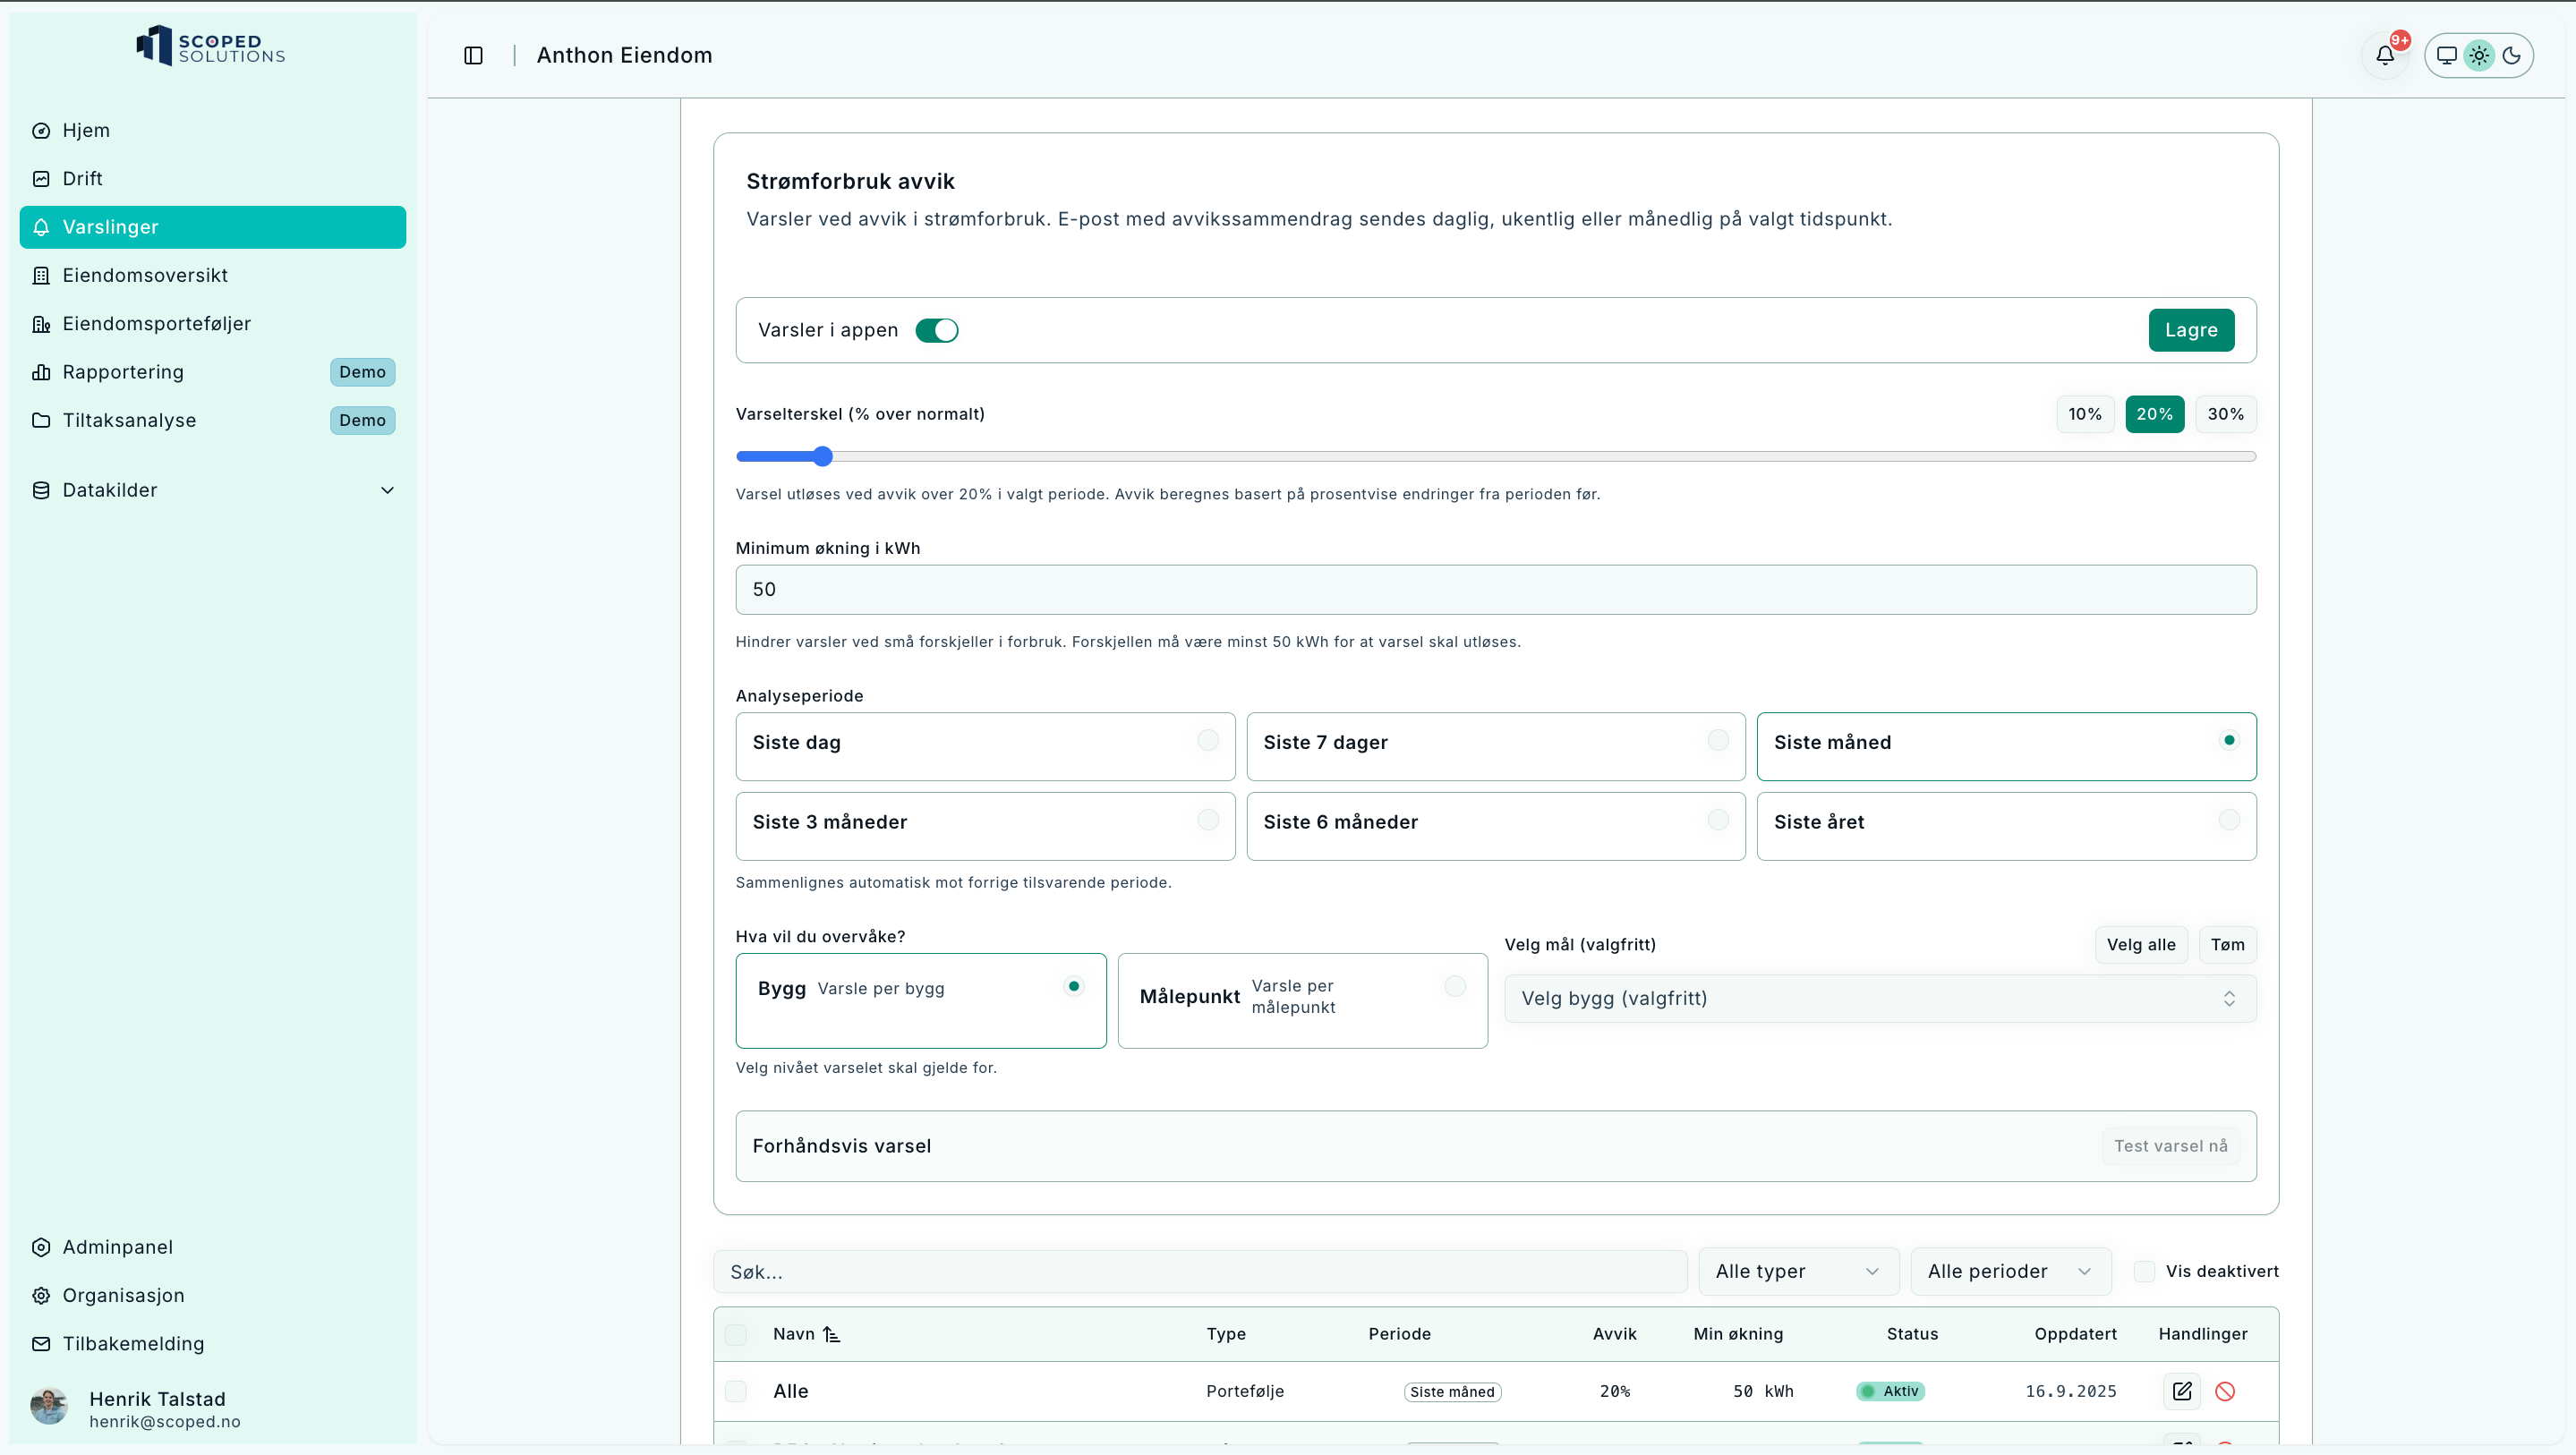
Alerts when consumption deviates from normal.
- Threshold in % above normal and minimum increase in kWh
- Period: day, week, month, 3/6 months, year
- Monitor per building or per meter
- Preview/test before activation
How to configure
- Toggle In-app alert
- Set Threshold (%) and Minimum increase (kWh)
- Select Analysis period
- Choose Per building or Per meter
- (Optional) Choose target/unit
- Click Save
Electricity price
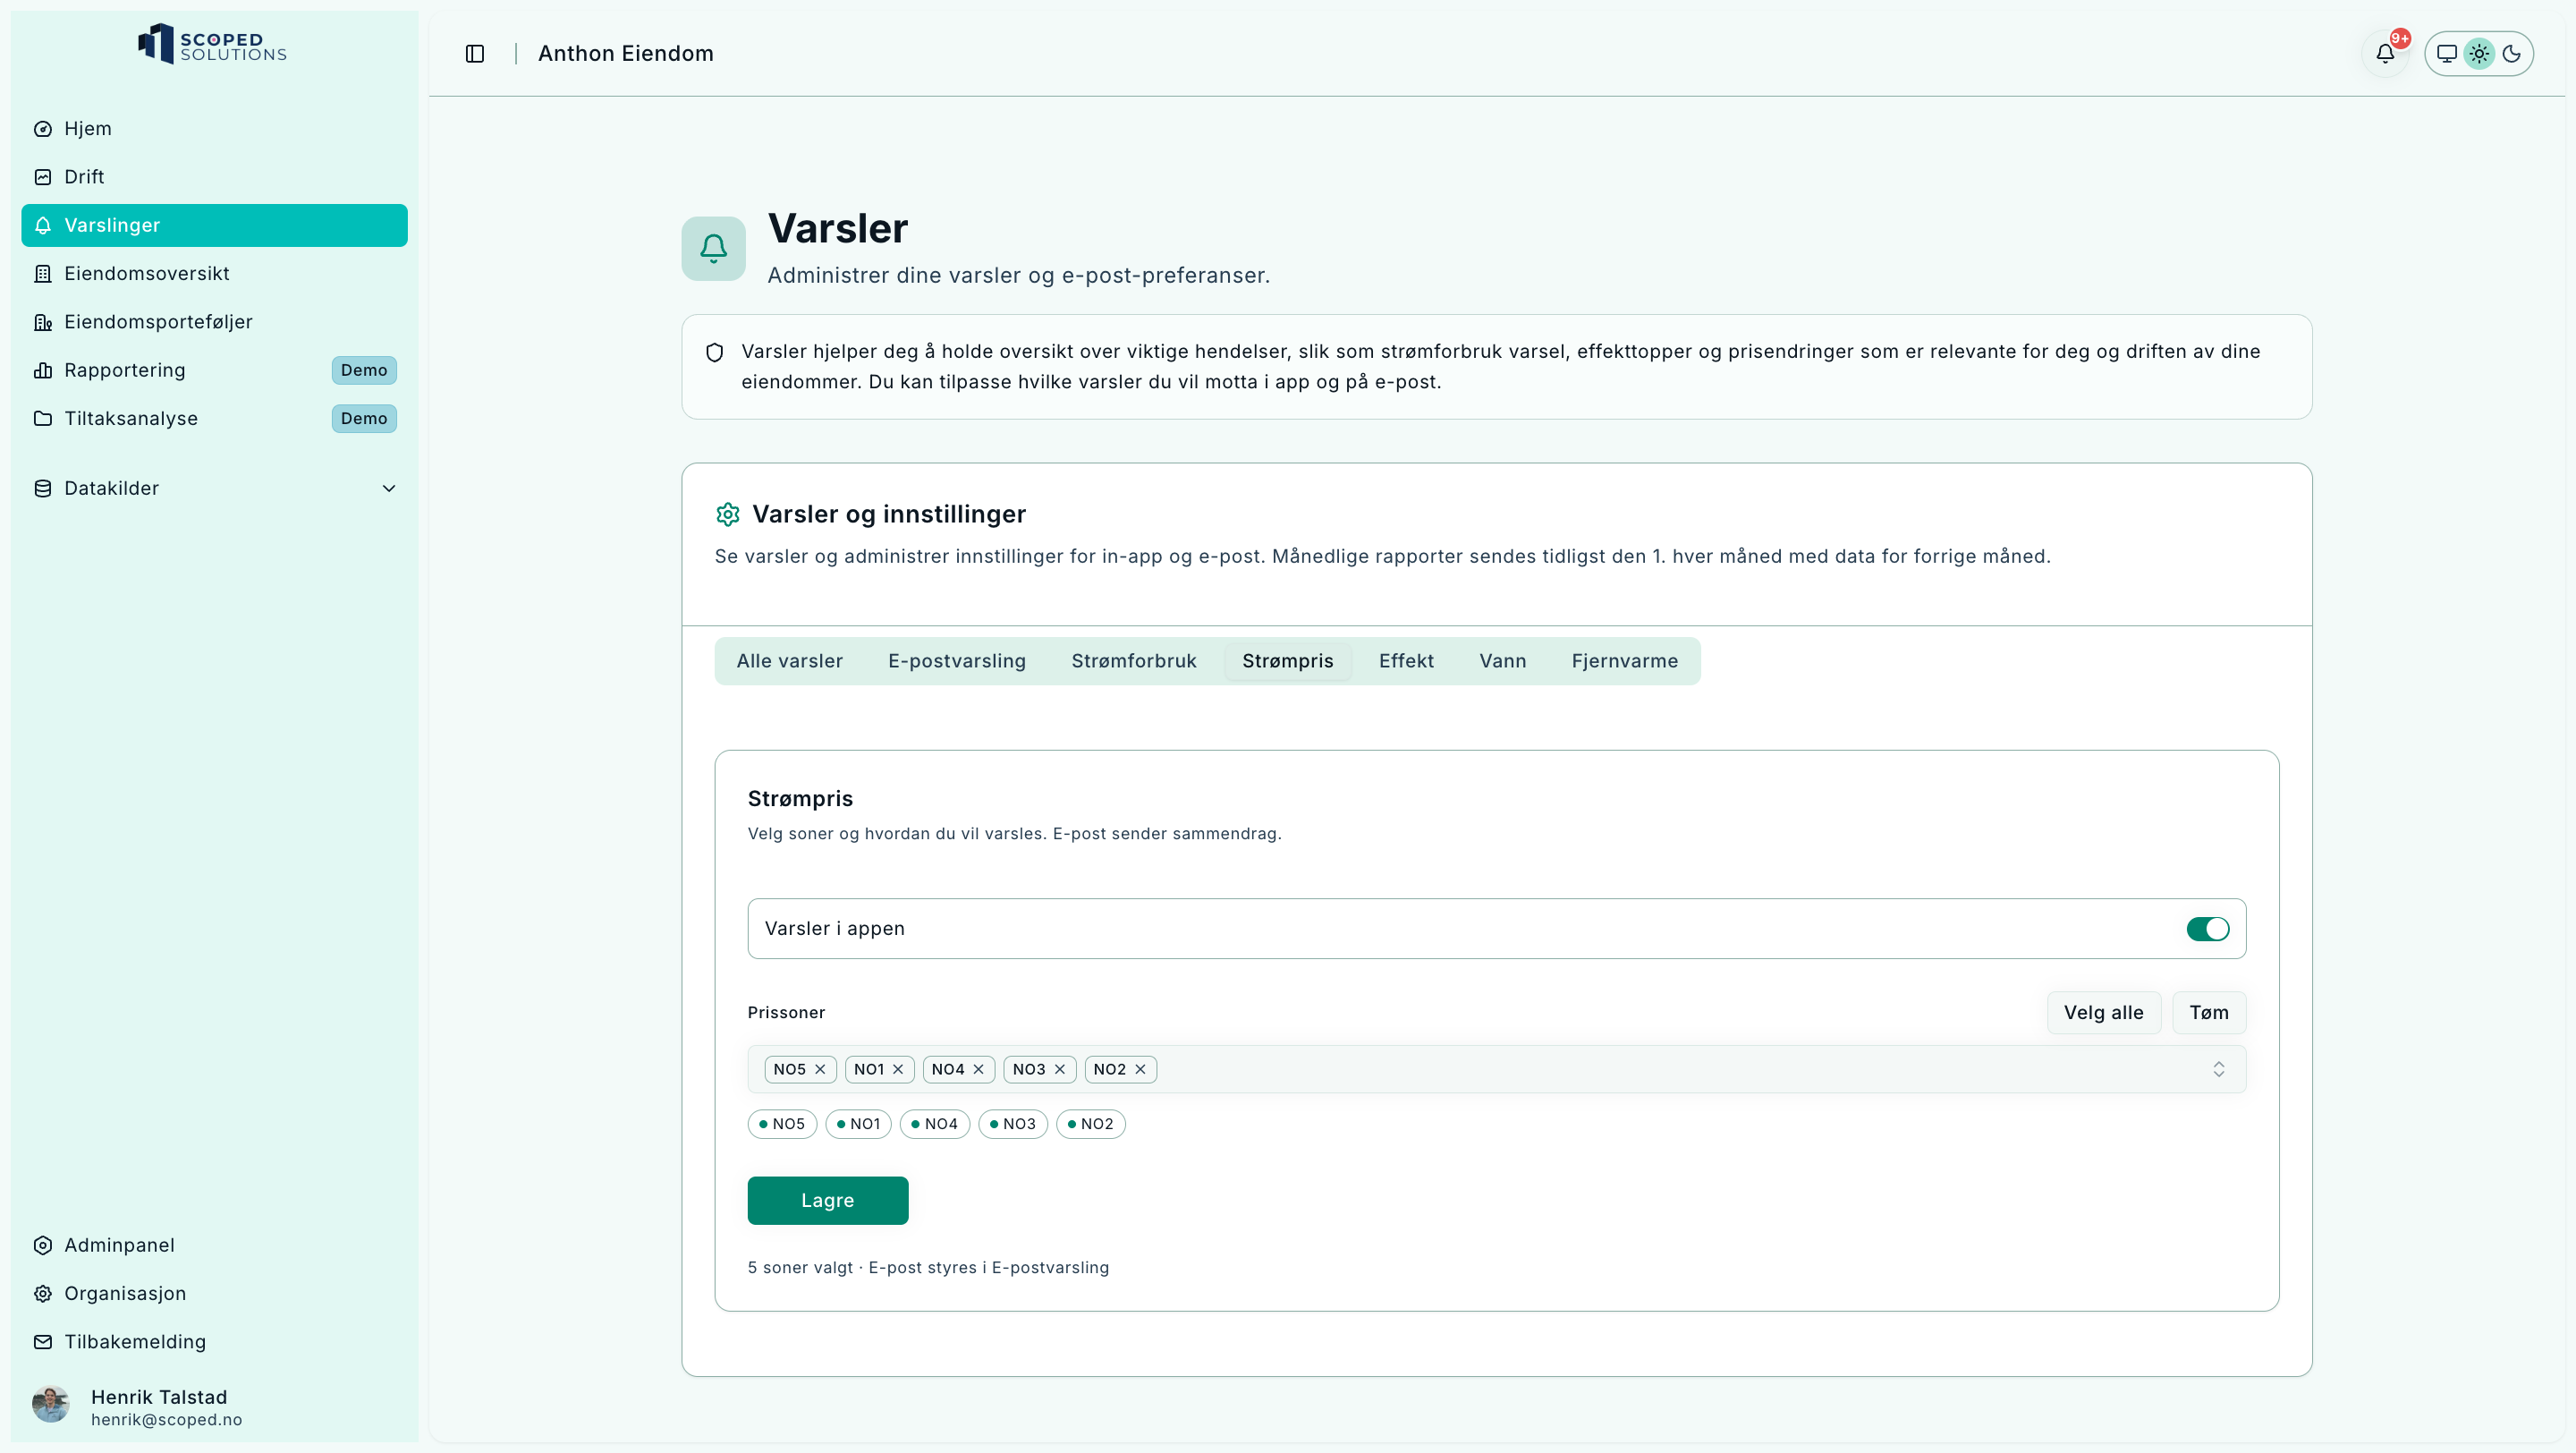
Track price levels and changes by price area.
- Shows current price, change since previous period, and cheapest/most expensive hour
- Price area (NO1–NO5) displayed in each card
How to configure
- Toggle In-app alert
- Select price areas (NO1–NO5) to monitor
- Click Save
Demand (power peaks)
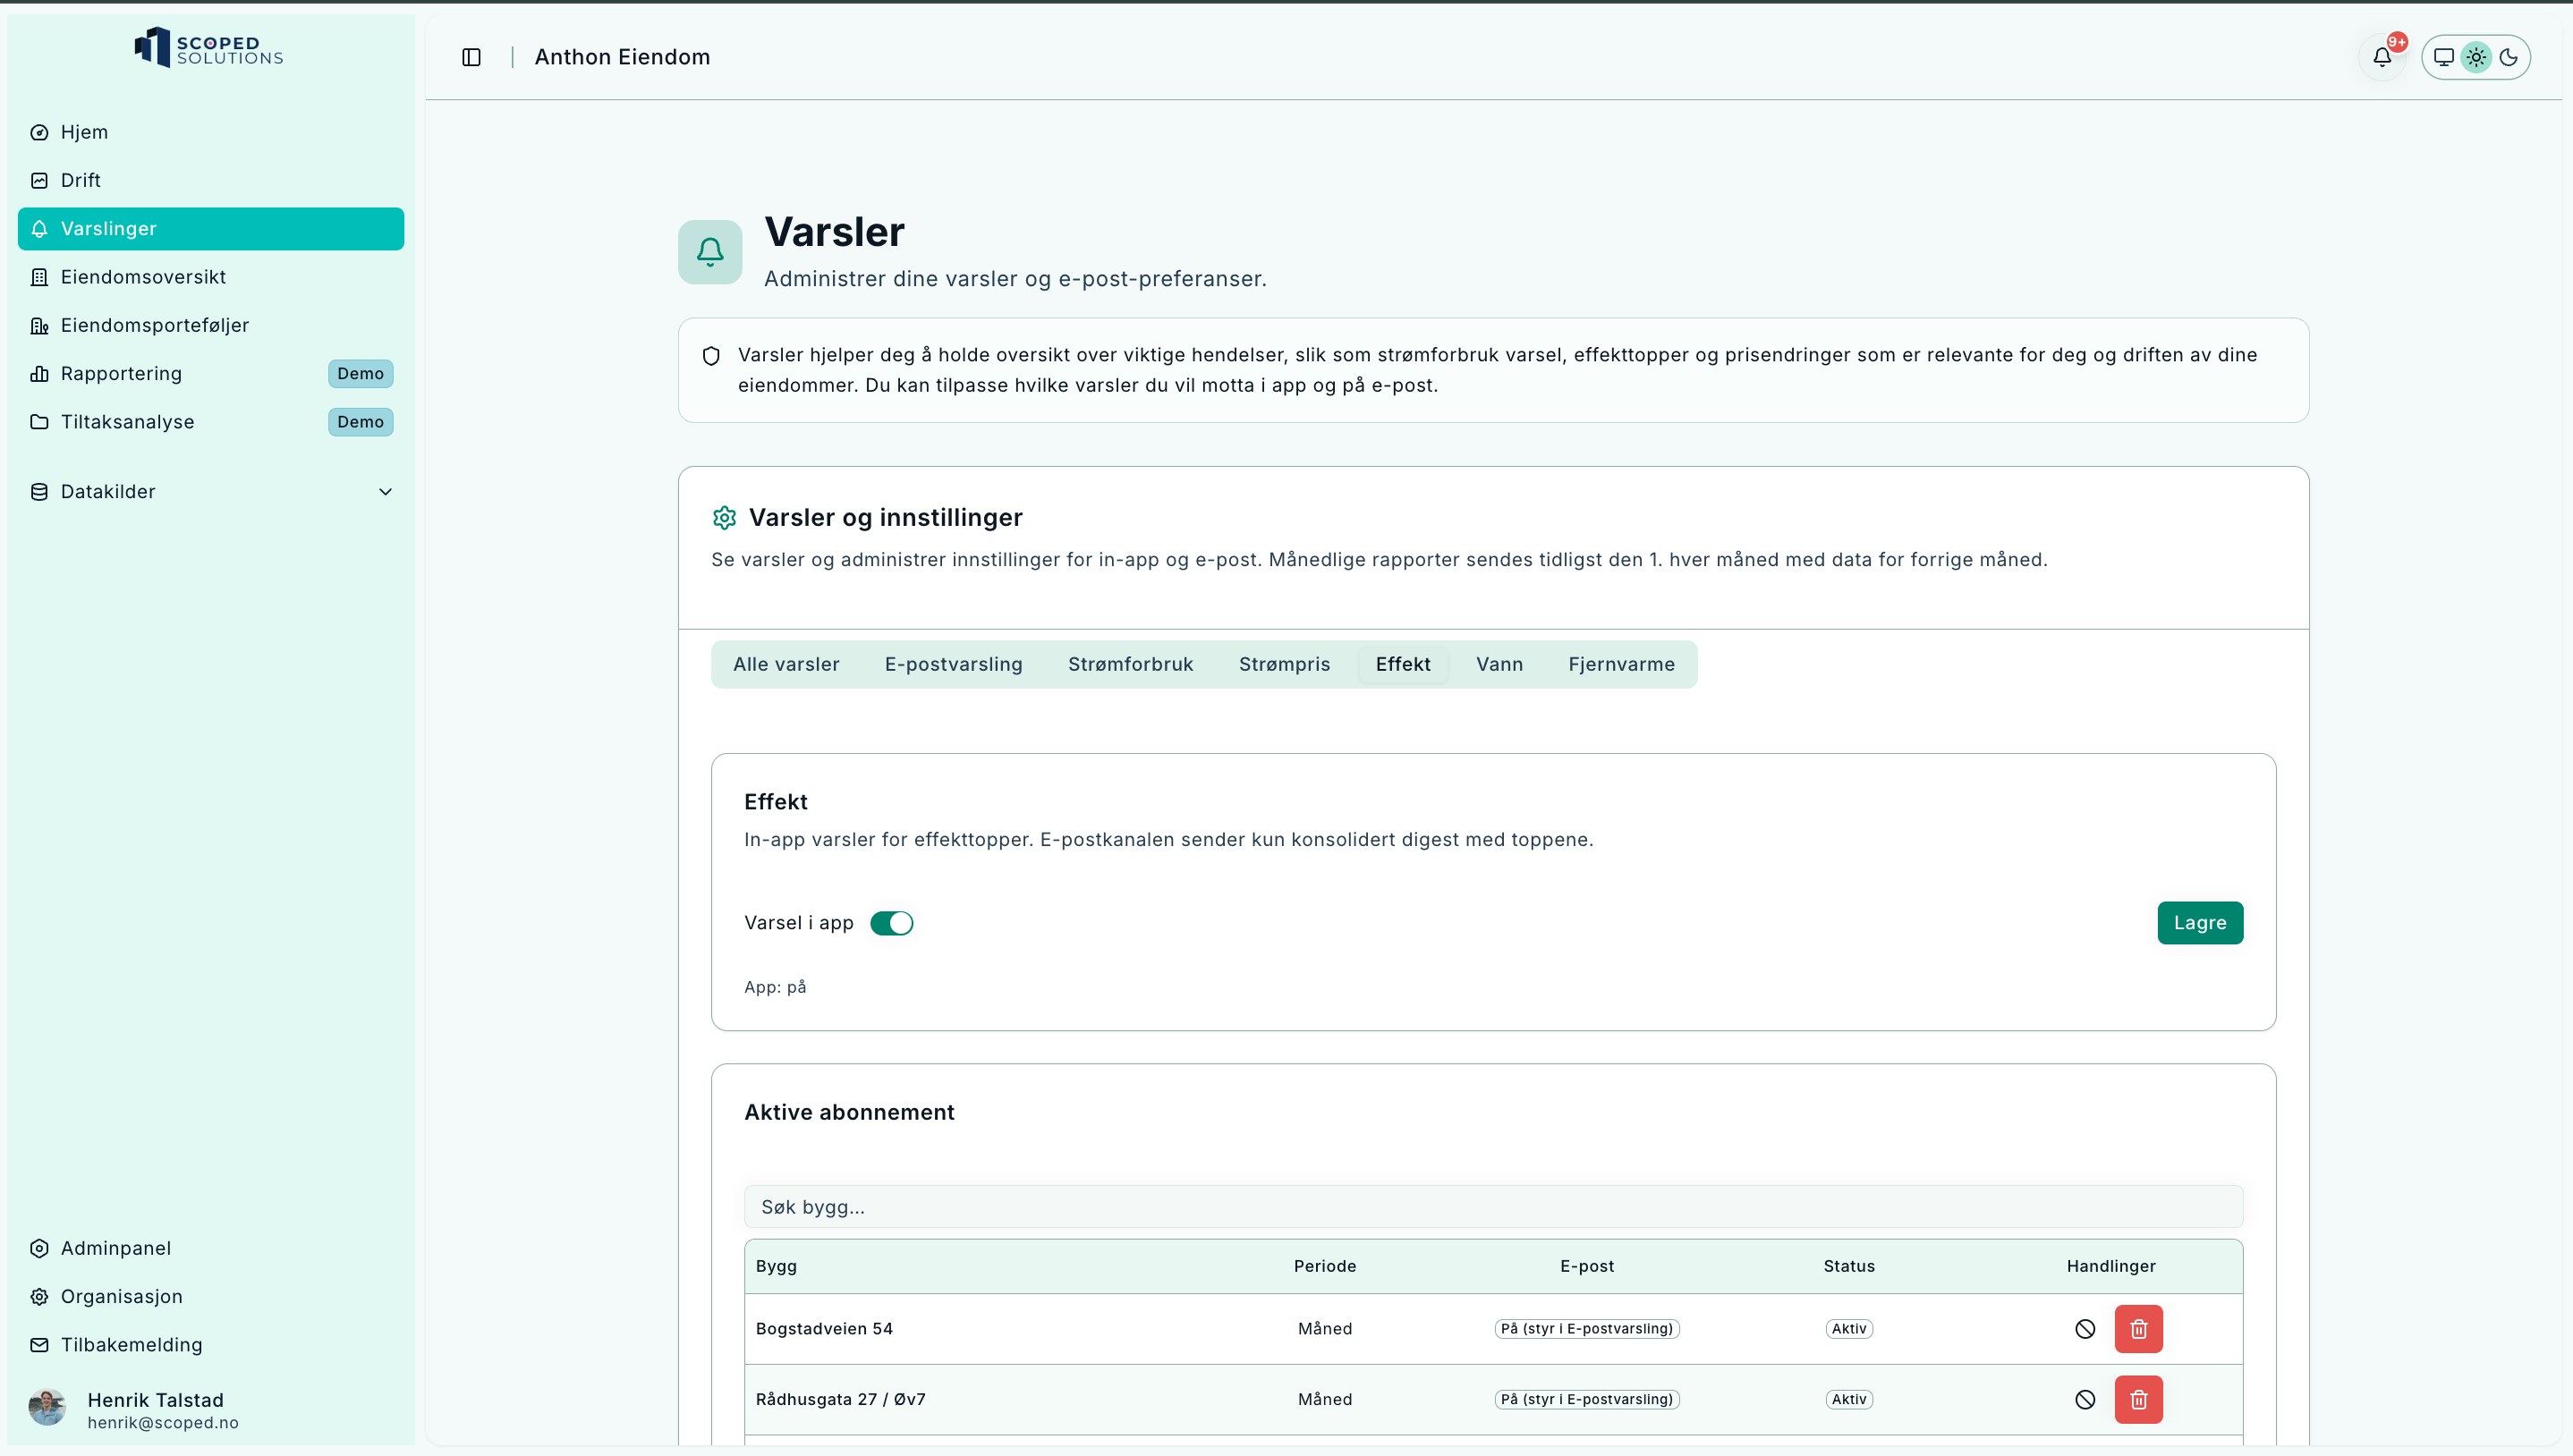
Monthly demand peaks at a glance.
- Shows monthly demand peaks
- May include steps (kW range) and grid operator
How to configure
- Toggle In-app alert
- Select Period (often Monthly for peaks)
- (Email) managed via the Email alerts tab
- Click Save – active subscriptions are shown below
Water
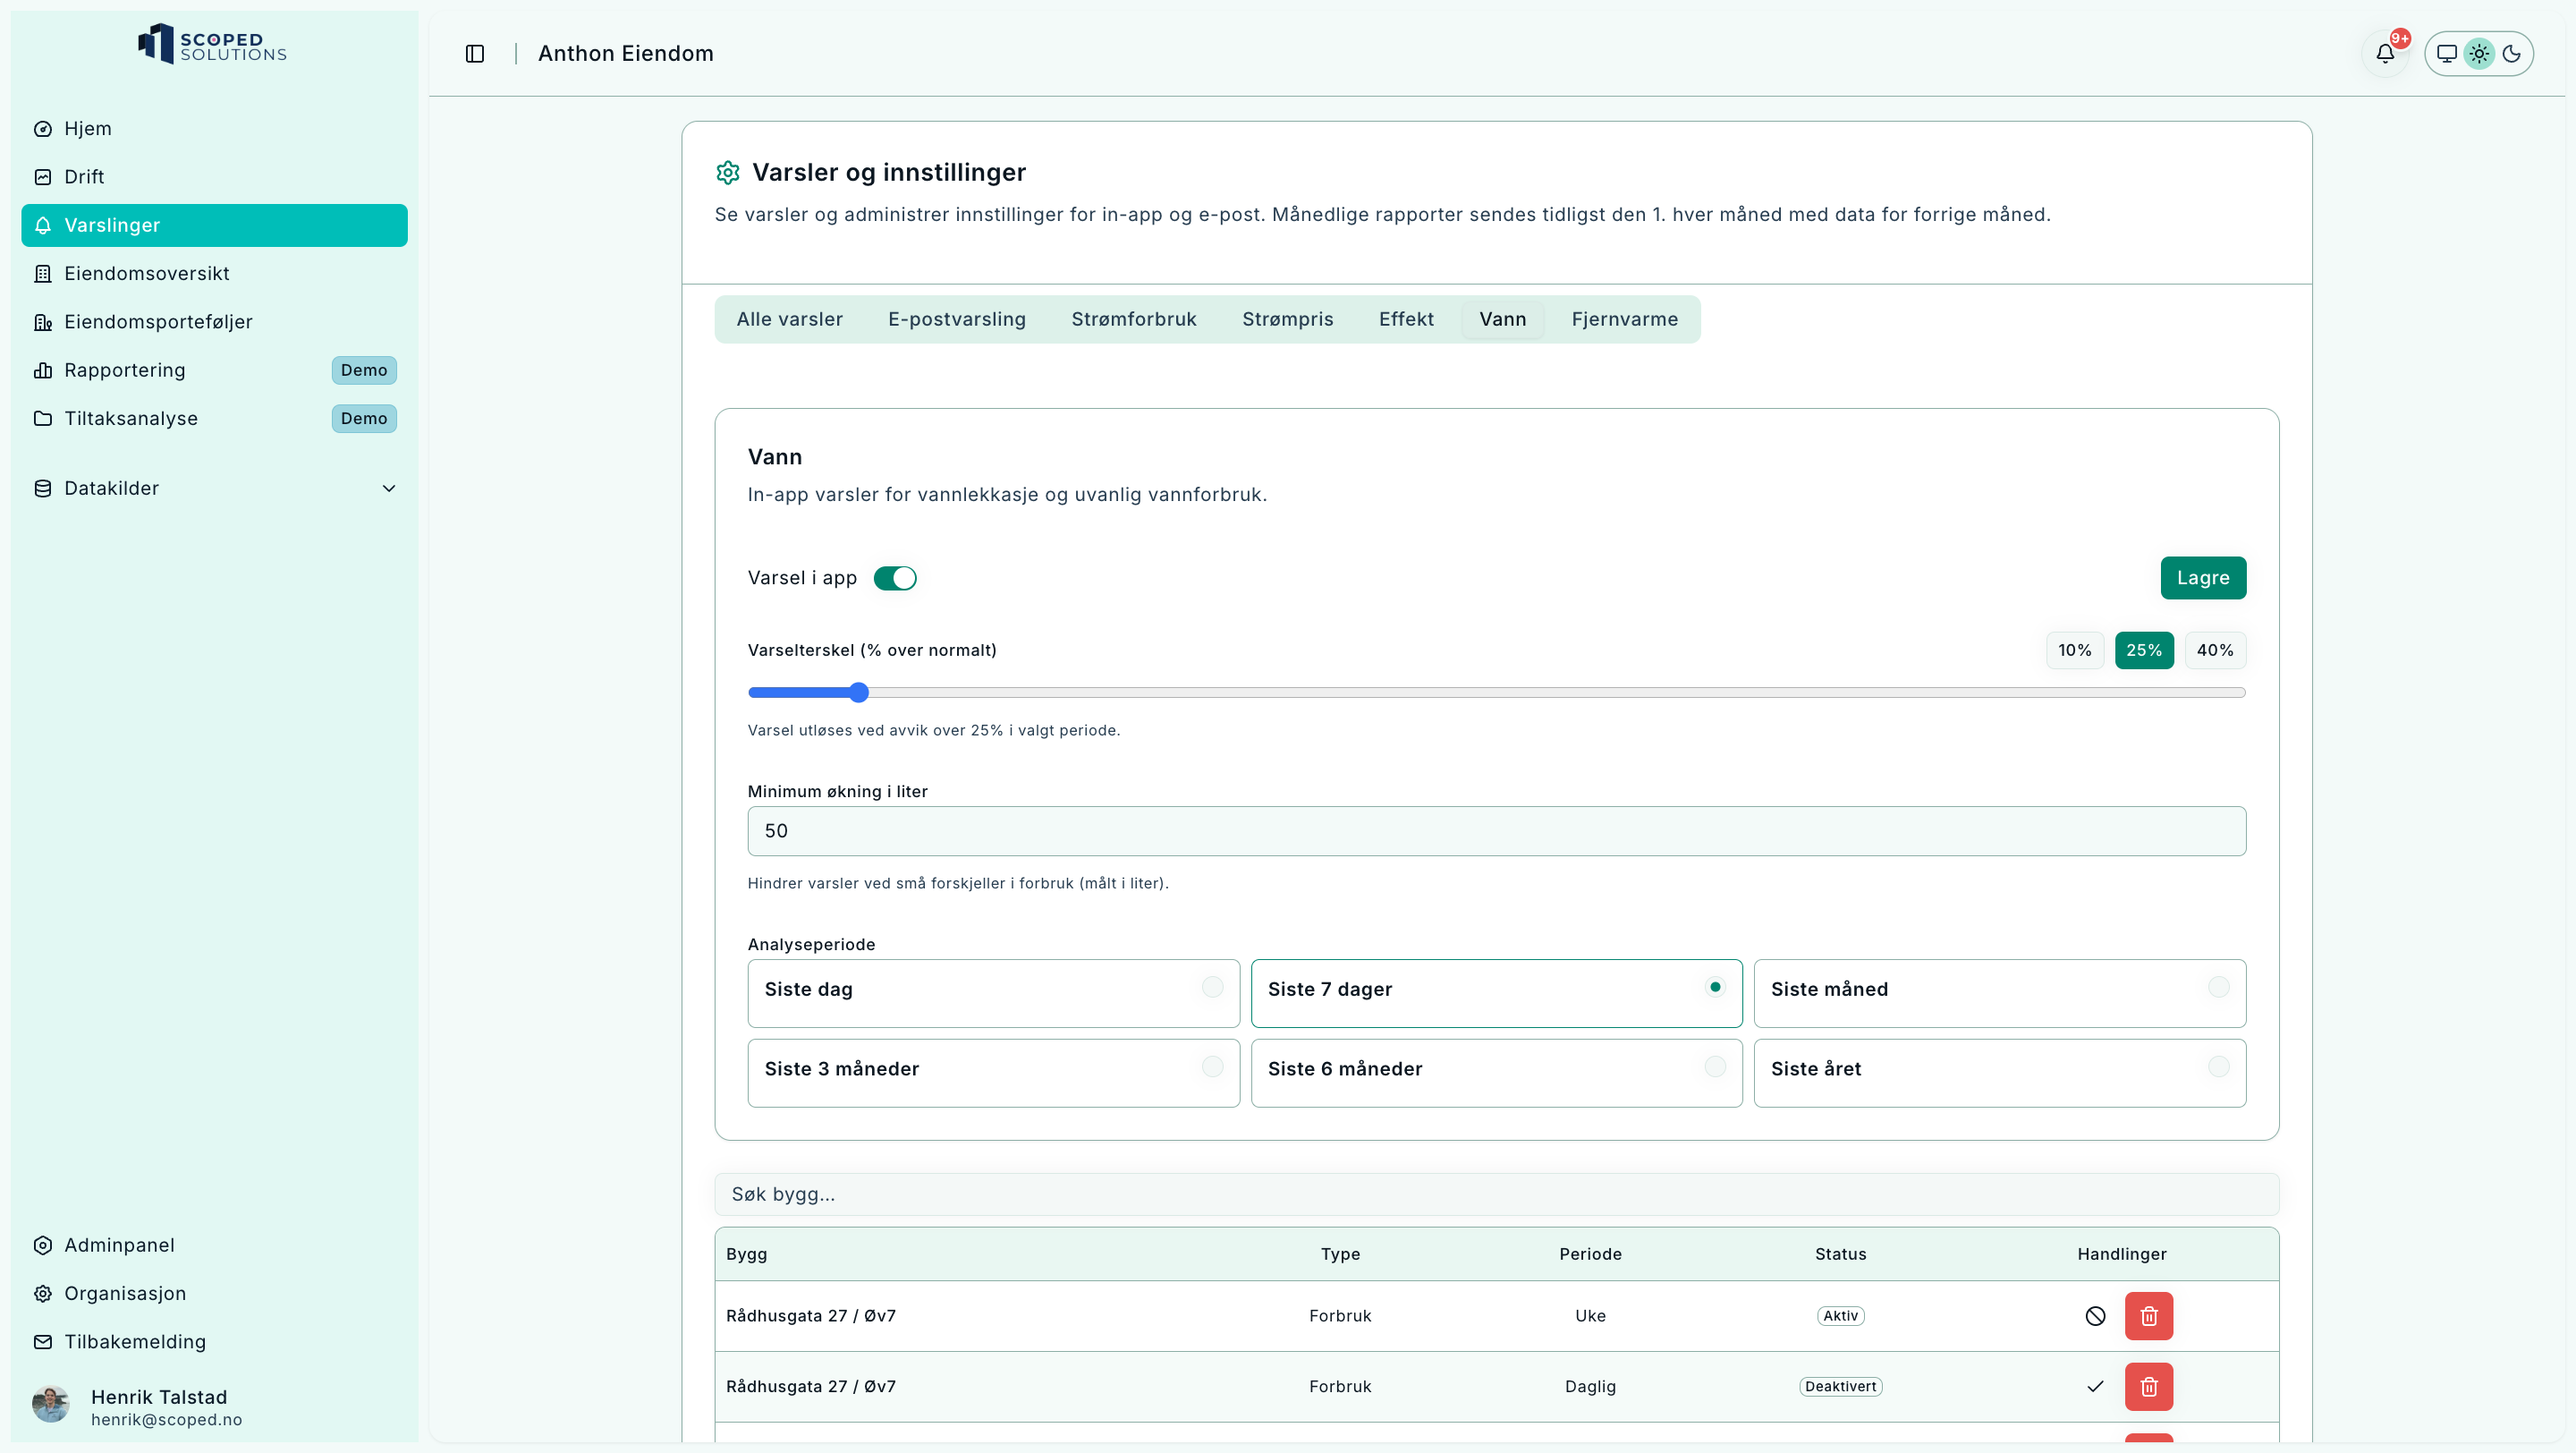
Detects leaks and unusual consumption.
- Shows change in liters and percent
- Events listed with timestamp and deviation
How to configure
- Toggle In-app alert
- Set Threshold (%) and Minimum increase (liters)
- Select Analysis period
- Click Save
District heating
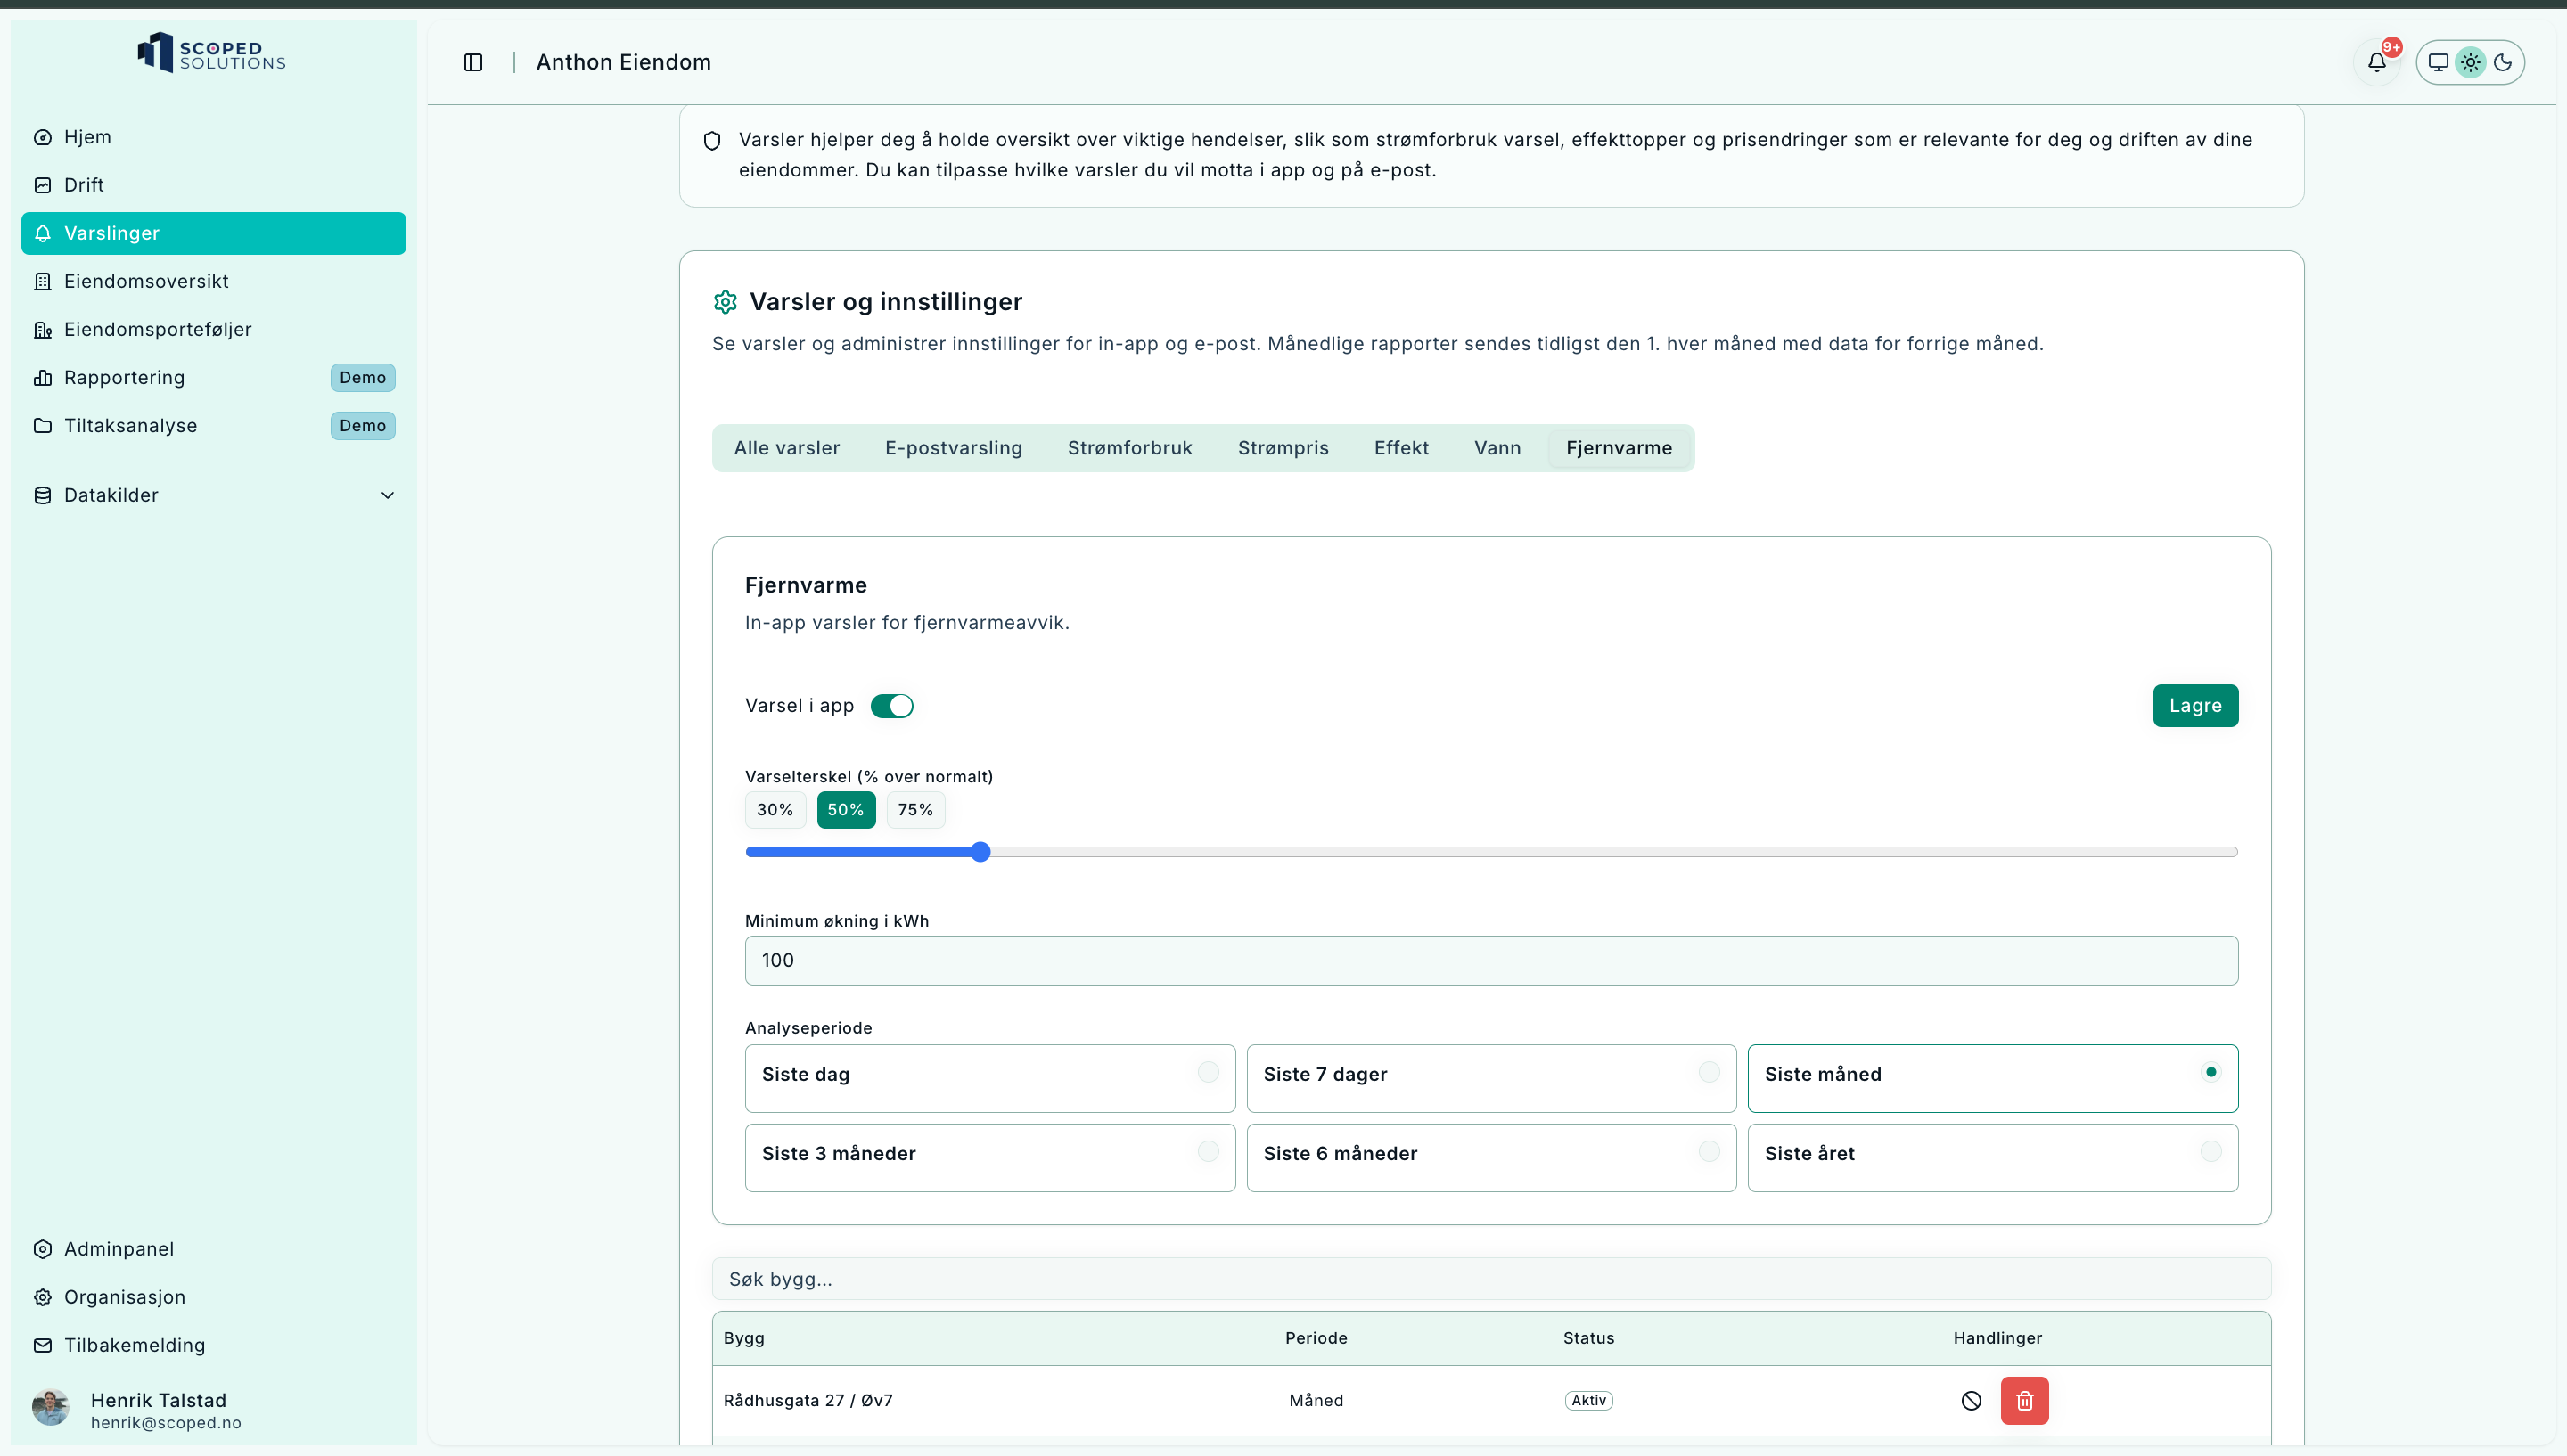
Alerts on district heating consumption and demand deviations.
- Deviations in consumption and demand
- Summary per building and meter
How to configure
- Toggle In-app alert
- Select Period
- (If available) adjust deviation thresholds
- Click Save – active subscriptions are shown below
How to use Notifications
- Open the bell for a quick status and mark items as read
- Go to the Notifications page for details by category
- Adjust Email alerts for delivery frequency and content
Frequently Asked Questions
-
Why don’t I see all tabs?
Some categories are only available if data sources are enabled in your organization. -
Can I mark an entire section as read?
In the bell, you mark single items; on the page, you clear items per category.