Home
Documentation of the Home page in Scoped – selection of building/portfolio, key figures and charts.
What is the Home page?
The /hjem page is the start page of our platform. Here you quickly get an overview of energy use, emissions, costs, and value – either for a single building or an entire portfolio.
At the top, you select building/portfolio and period, then you get key figures in cards and interactive charts in the tabs at the bottom of the page.
How the page works
1. Select building/portfolio
- Use the dropdown at the top to select a portfolio or single building.
- All figures and charts update automatically.
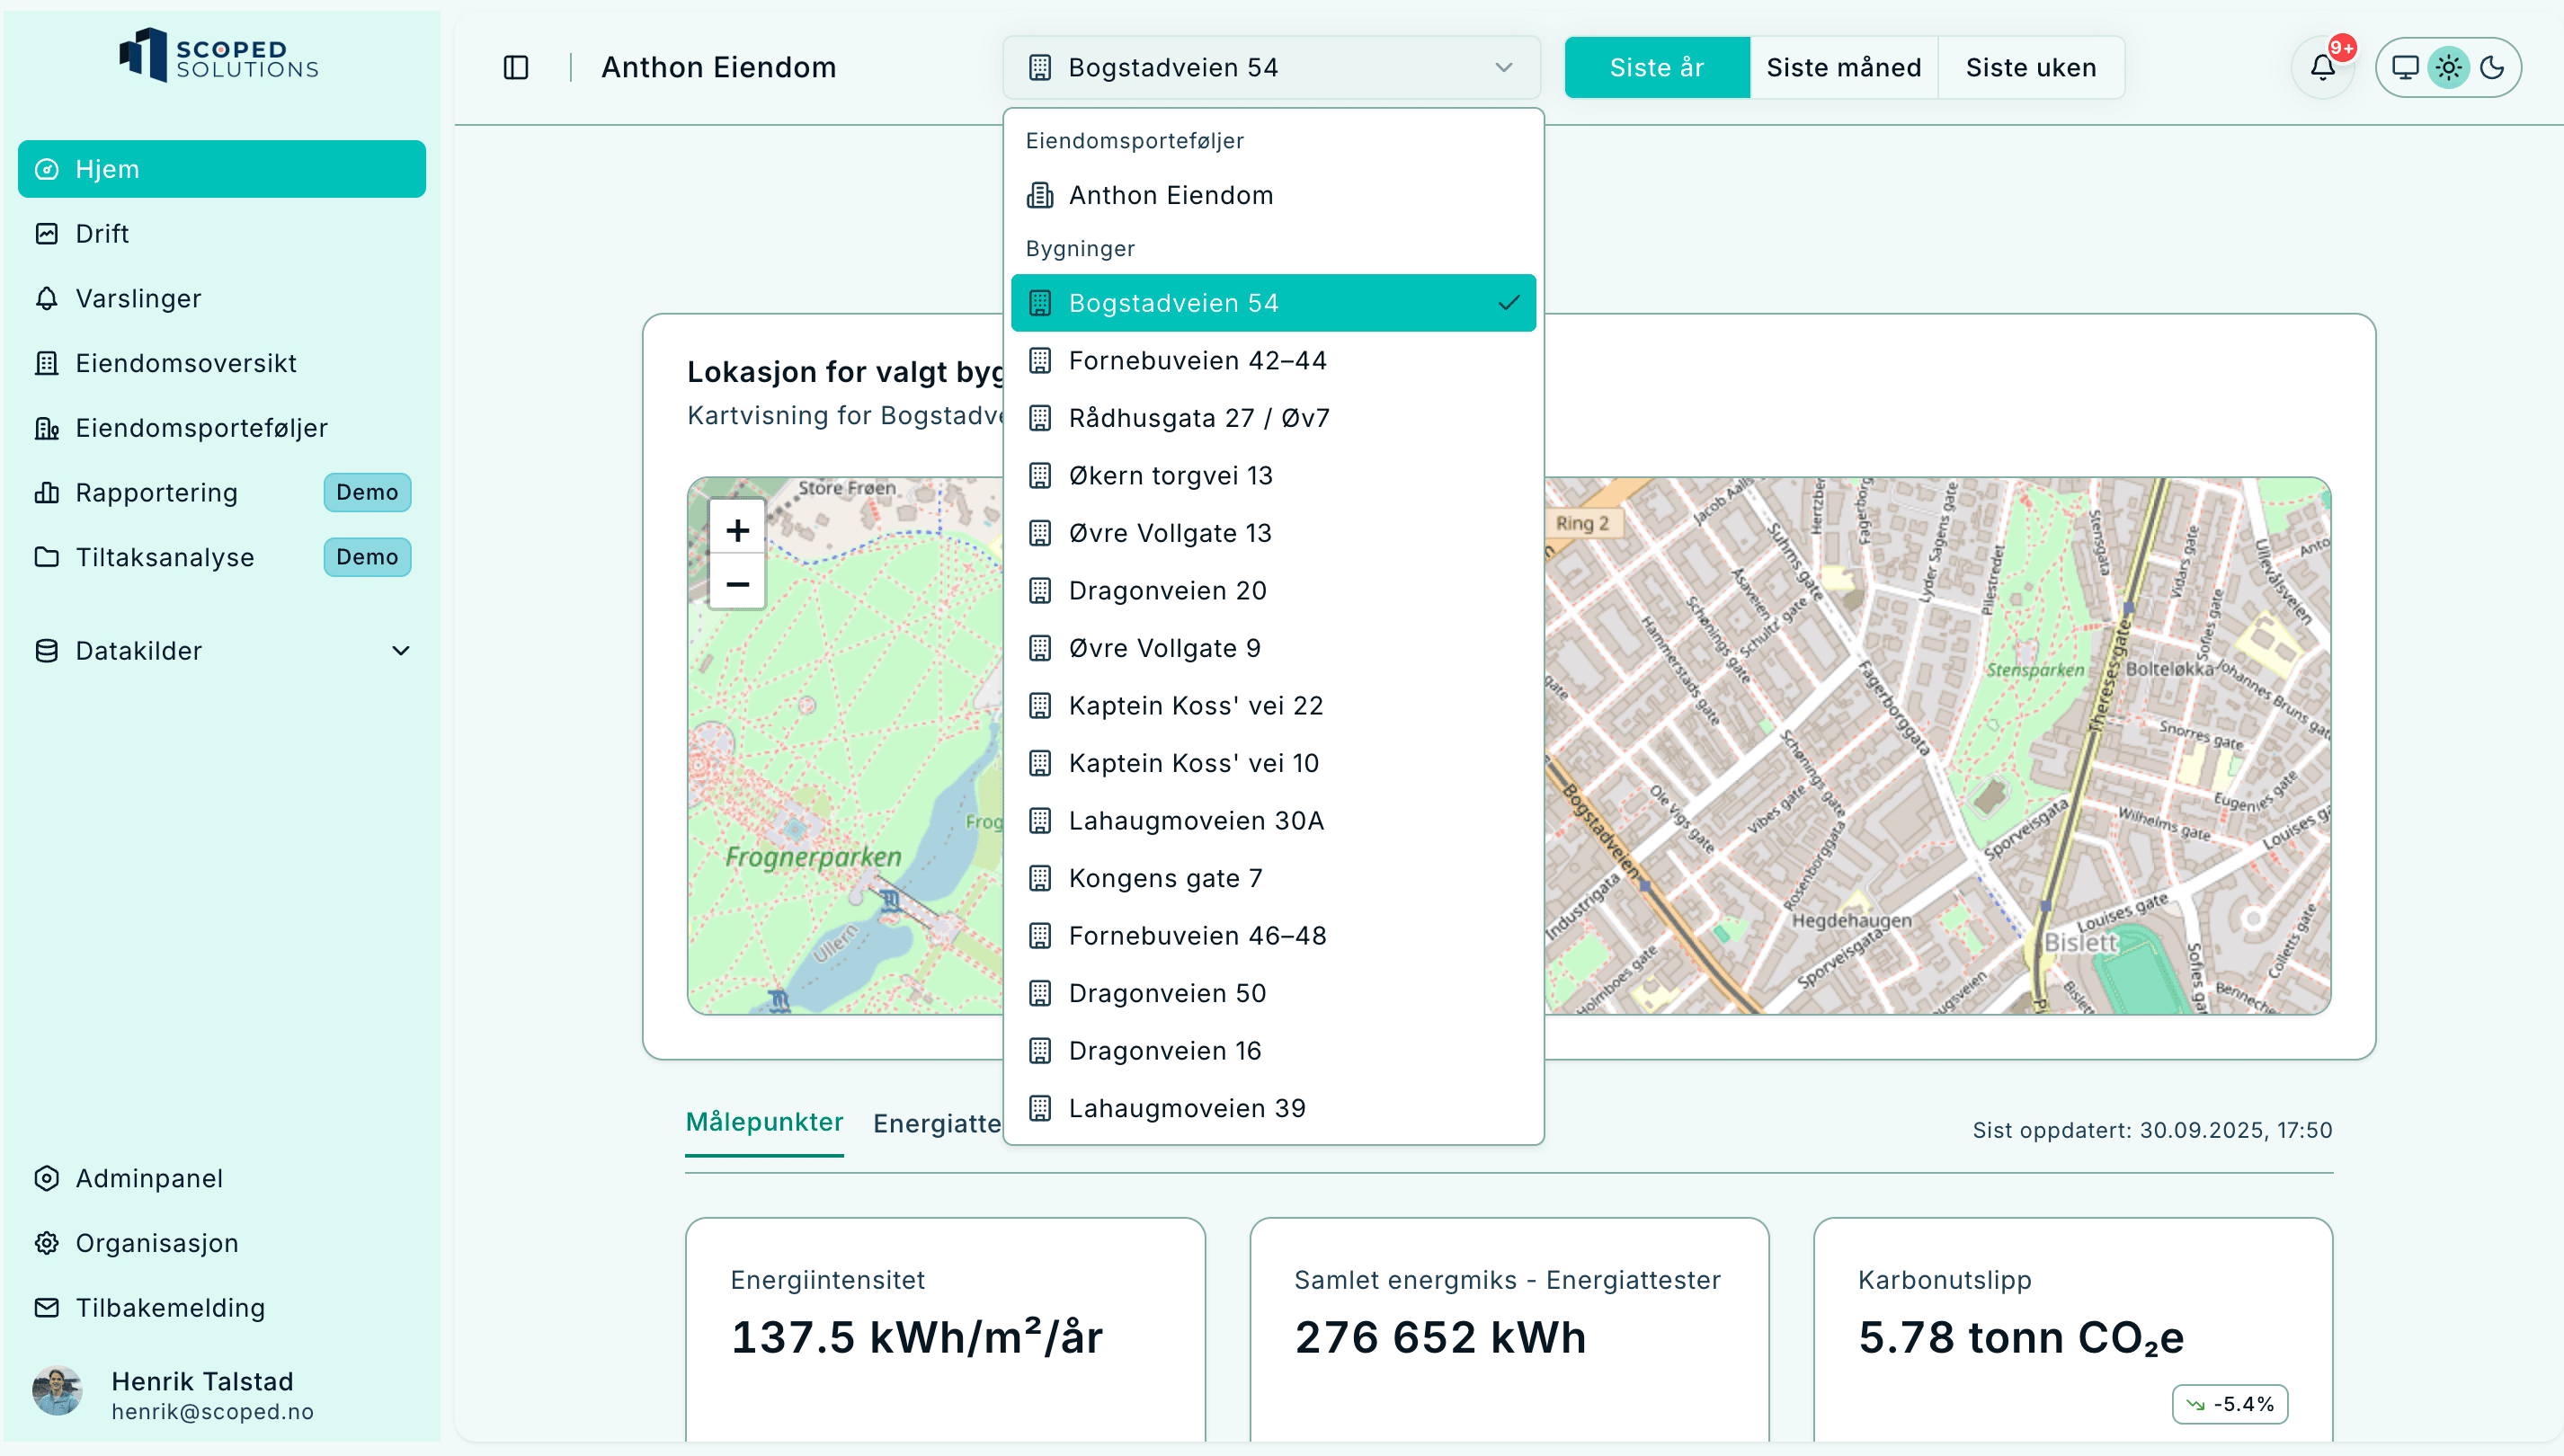
👉 Example: “Bogstadveien 54” (single building) or “Anthon Eiendom” (portfolio).
2. Select period
- Quick options: Last year, Last month or Last week.
- Affects both the cards and the charts.
Key figures in cards
When you have selected building/portfolio and period, you get the most important figures in cards:
- Energy intensity (kWh/m²/year) – how efficiently the building/portfolio uses energy.
- Energy use (kWh) – total consumption, often divided by day/night and electricity/district heating.
- Carbon emissions (tons CO₂e) – calculated from the energy use.
- Energy cost (NOK) – spot price + grid tariff.
- Grid cost (NOK) – divided into energy component, fixed component, and taxes.
- Property value (NOK) – estimated market value based on energy and area.
You can switch between actual metering data (Metering points) and theoretical values (Energy certificates) at the top of the card section.
Tabs with details and charts
At the bottom you find tabs for more detailed insights:
- Energy – shows consumption or costs over time, with separate series for electricity and district heating.
- Water consumption – shows water use in liters during the selected period.
- Spot price – shows the price curve for the selected price area (zone).
- CRREM – compares energy use with international emission pathways.
- Metering points – details for individual meters.
- Waste – shown if data exists (only for “Last year”).
Practical use
- Change period to see how energy use, costs, and emissions develop.
- See where consumption happens – day/night, electricity/district heating.
- Use Spot price to see how price affects costs.
- Go from overview to details in Metering points.
- Compare theoretical (Energy certificates) with actual (Metering points).
Glossary
- Energy intensity – kWh per m² per year, efficiency indicator.
- Grid tariff – cost for electricity transport (energy component, fixed component, taxes).
- CRREM – international emission reduction pathways for real estate.
FAQ
- Why don’t I see Waste? Only shown if data exists, and only for “Last year”.
- Why does consumption stop at yesterday? To ensure complete days. Spot price may include today’s hours.
- Why can’t I change source in CRREM? The option only appears when both metering data and certificate data exist.